Infrared and Thermography
Infrared and thermal testing is one of many Nondestructive testing techniques designated by the American Society for Nondestructive Testing. Infrared Thermography is the science of measuring and mapping surface temperatures.
“Infrared thermography, a nondestructive, remote sensing technique, has proved to be an effective, convenient, and economical method of testing concrete. It can detect internal voids, delaminations, and cracks in concrete structures such as bridges decks, highway pavements, garage floors, parking lot pavements, and building walls. As a testing technique, some of its most important qualities are that (1) it is accurate; (2) it is repeatable; (3) it need not inconvenience the public; and (4) it is economical.”
How It Works
An infrared thermographic scanning system can measure and view temperature patterns based upon temperature differences as small as a few hundredths of a degree Celsius. Infrared thermographic testing may be performed during day or night, depending on environmental conditions and the desired results.
All objects emit electromagnetic radiation of a wavelength dependent on the object’s temperature. The frequency of the radiation is inversely proportional to the temperature. In infrared thermography, the radiation is detected and measured with infrared imagers (radiometers). The imagers contain an infrared detector that converts the emitting radiation into electrical signals that are displayed on a color or black & white computer display monitor.
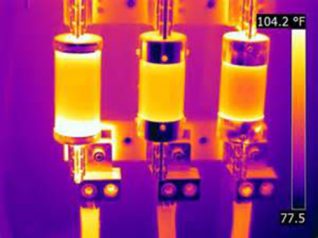
A typical application for regularly available IR Thermographic equipment is looking for “hot spots” in electrical equipment, which illustrates high resistance areas in electrical circuits. These “hot spots” are usually measured in the range of 40 °C to 150 °C (70 to 270 °F) above ambient temperatures. But, when engineers use its patented proprietary systems to locate subsurface targets such as Underground Storage Tanks (USTs), pipelines, pipeline leaks and their plumes, and in this project, hidden tunnels, we are looking for temperature patterns typically in the range of 0.01 °C to 1 °C above or below ambient temperatures.
After the thermal data is processed, it can be displayed on a monitor in multiple shades of gray scale or color. The colors displayed on the thermogram are arbitrarily set by the Thermographer to best illustrate the infrared data being analyzed.
An infrared thermographic scanning system measures surface temperatures only. But the surface temperatures that are measured on the surface of the ground, above a buried pipeline, are, to a great extent, dependent upon the subsurface conditions.
The subsurface configuration effects are based upon the theory that energy cannot be stopped from flowing from warmer to cooler areas, it can only be slowed down by the insulating effects of the material through which it is flowing. Various types of construction materials have different insulating abilities. In addition, differing types of pipeline defects have different insulating values.